Kaggleで使う構文 データの様子を探る
importしたもの
import pandas as pd
import seaborn as sns
使用した構文
列名を羅列
<DataFrame>.columns
出力例
Index(['Id', 'MSSubClass', 'MSZoning', 'LotFrontage', 'LotArea', 'Street',
       'Alley', 'LotShape', 'LandContour', 'Utilities', 'LotConfig',
       'LandSlope', 'Neighborhood', 'Condition1', 'Condition2', 'BldgType',
       'HouseStyle', 'OverallQual', 'OverallCond', 'YearBuilt', 'YearRemodAdd',
       'RoofStyle', 'RoofMatl', 'Exterior1st', 'Exterior2nd', 'MasVnrType',
       'MasVnrArea', 'ExterQual', 'ExterCond', 'Foundation', 'BsmtQual',
       'BsmtCond', 'BsmtExposure', 'BsmtFinType1', 'BsmtFinSF1',
       'BsmtFinType2', 'BsmtFinSF2', 'BsmtUnfSF', 'TotalBsmtSF', 'Heating',
       'HeatingQC', 'CentralAir', 'Electrical', '1stFlrSF', '2ndFlrSF',
       'LowQualFinSF', 'GrLivArea', 'BsmtFullBath', 'BsmtHalfBath', 'FullBath',
       'HalfBath', 'BedroomAbvGr', 'KitchenAbvGr', 'KitchenQual',
       'TotRmsAbvGrd', 'Functional', 'Fireplaces', 'FireplaceQu', 'GarageType',
       'GarageYrBlt', 'GarageFinish', 'GarageCars', 'GarageArea', 'GarageQual',
       'GarageCond', 'PavedDrive', 'WoodDeckSF', 'OpenPorchSF',
       'EnclosedPorch', '3SsnPorch', 'ScreenPorch', 'PoolArea', 'PoolQC',
       'Fence', 'MiscFeature', 'MiscVal', 'MoSold', 'YrSold', 'SaleType',
       'SaleCondition', 'SalePrice'],
      dtype='object')
describe
<DataFrame>.describe()
出力例
count      1460.000000
mean     180921.195890
std       79442.502883
min       34900.000000
25%      129975.000000
50%      163000.000000
75%      214000.000000
max      755000.000000
Name: SalePrice, dtype: float64
ヒストグラムと推定される確率分布関数を表示
sns.distplot(<DataFrame>[列名]);
出力例

Dataframeの結合
<名前> = pd.concat(<Dataframe1>, <Dataframe2>, axis = 1)
axis = 0 なら行を追加、1なら列を追加
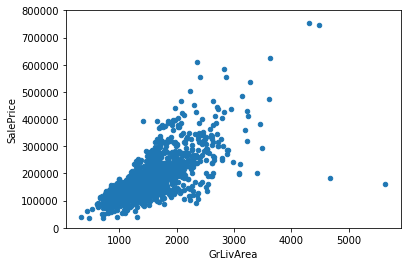
散布図
<DataFrame>.plot.scatter(x = <x軸とする列名>, y = <y軸とする列名> , ylim = (<y軸の最小値>, <最大値>))
出力例

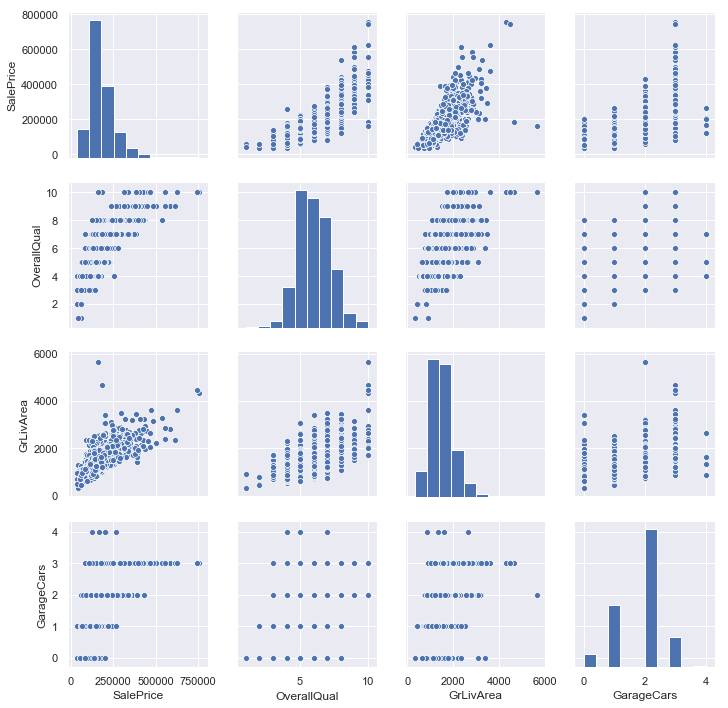
複数データを同時に表示
sns.pairplot(<DataFrame>)
出力例

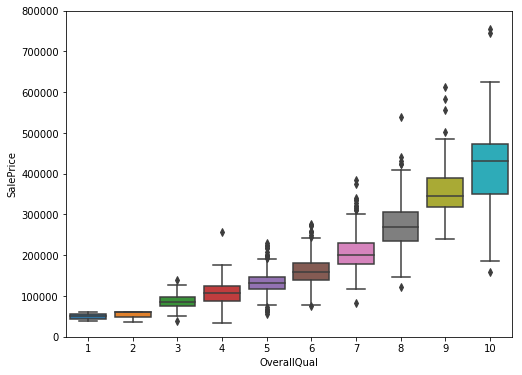
箱ひげ図
sns.boxplot(x = <xのlabel名>, y = <label y>, data = <2列のDataFrame>)
出力例

相関行列の取得
<名前> = <Dataframe>.corr()
ヒートマップ
sns.heatmap(<相関行列>);
その他引数
- annot = True にするとヒートマップ上に数値が表示される
- square=True にすると正方形の形で示される
- fmt='.2f' でヒートマップ上の数値の表示桁数を変えられる。`.2f`の数字を変えればよい
- annot_kws = {"size": 値} で数値の表示サイズが変わる
出力例

dataframeのうち値が大きいものをn行取得
<名前> = <DataFrame>.nlargest(<n>, <対象列名>)
行名取得
<名前> = <DataFrame>.index
数値データのみの列名を取得
<DataFrame>.dtypes[<DataFrame>.dtypes != "object"].index